How to debug Azure Logic Apps

One of the most frequent problems we face during troubleshooting the logic app is, identifying the run associated with a logic app.
It is a bit easy when we have a few runs in a day. When a problem is reported, we could ask for the time when it occurred and use the time stamp to find the run, thorough run history. But when have
- some thousands of runs per day?
- If you know the time frame, you can filter for failed runs. But all of them show success even though there is something wrong (This is because of how you coded your logic app)
In this blog, we will see
- how to troubleshoot logic app errors.
- What is the best practice we need to follow during development so we can troubleshoot the issues super quick in the Production environment?
Before you begin
You need to have a log analytic workspace configured for your logic apps. Without this, debugging in production can be a nightmare.
Long story short - When log analytics are configured properly, It will ingest log data into the workspace repository. We can then go to the Log Analytics workspace, and query the logs to see logic app execution details.
Tracked Properties Makes debugging easy
You can track the input or output of action in the logic app using tracked properties.
When Tracked Properties are configured in a logic app, while execution this data will be ingested to log analytics and it will be associated with the run instance.
This is very useful for debugging purposes.
For example, if you have an HTTP trigger logic app that receives numerous requests from different clients, it is hard to track back which run instance is associated with which client. If we log Client ID using tracked properties, we can simply query in log analytics using a Client ID, and find the run ID. We can this run ID to find out the running instances.
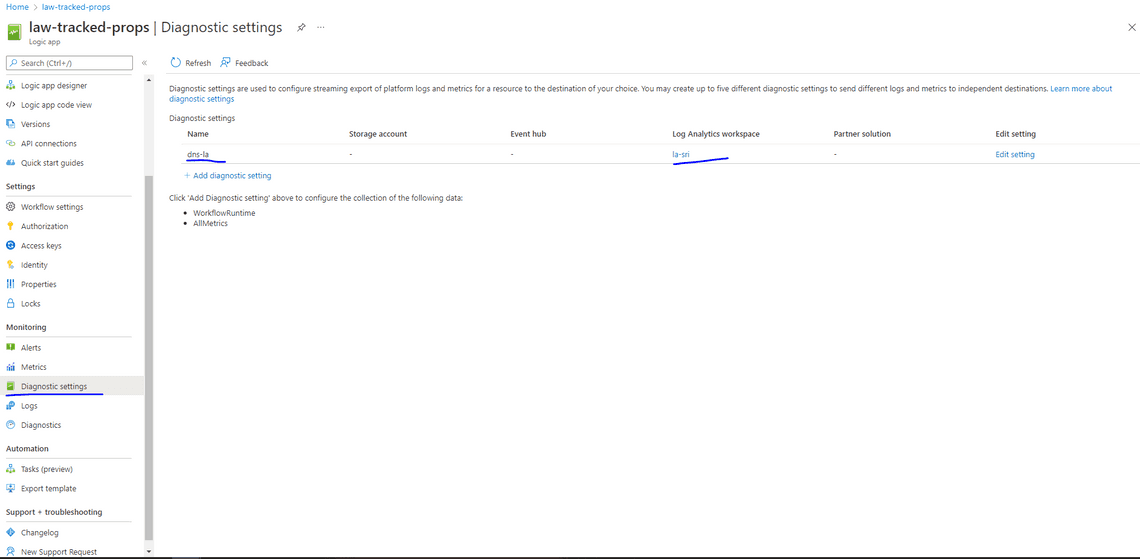
Configure Log Analytic workspace for the logic app
Go to the Azure portal and open the logic app. Go to Diagnostic settings. Configure log analytic workspace so it can ingest logs into it.

Configure tracked properties
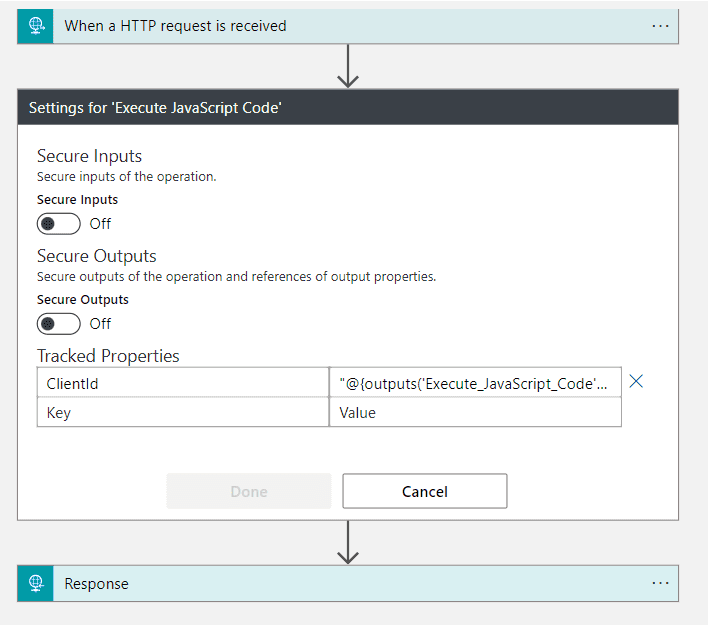
In the Azure portal, open the logic app in edit mode. Open settings of which you are looking to configure tracked properties. This action holds the data identifier in form of input or output which you can use to identify the logic app run.
You can find the Traced Properties section in the settings. Now enter Key and Value
Key: Give a name to track property.
Value: Read desired input/output value of action - ex: ”@{outputs(‘Execute_JavaScript_Code’)?[‘body’]['id']}”

Now when this logic app runs, it will start logging tracked properties. This tracked property will be added to a new column in the AzureDiagnositic table.
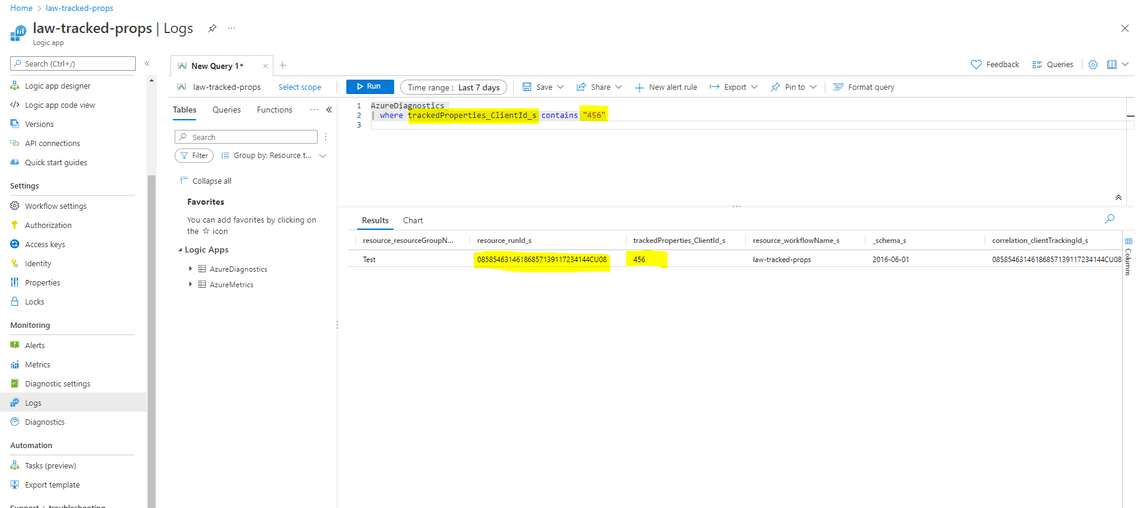
Go to Log Analytic Workspace logs, and search with the tracked property.
AzureDiagnostics
| where trackedProperties_ClientId_s contains "456"

When a problem is reported, get the Identifier, go to log analytic workspace, search with an identifier, and get the run id associated with it. Go to logic app run history and search with run id.
Newsletter
Related Posts
Legal Stuff

